Latest Research Results
Machine Learning Approaches Using Non-Linear Multimodal Imaging for Biomedical Diagnostics
Non-linear multimodal imaging modalities, such as coherent anti-Stokes Raman scattering, two photon excited fluorescence and second harmonic generation, are label-free imaging techniques that provides intrinsic molecular contrast. As these imaging techniques and the resulting data are untargeted, their interpretation requires advanced image analysis methods like machine learning approaches.
By Nairveen Ali // Pranita Pradhan // Elsie Quansah // Hyeonsoo Bae // Tobias Meyer // Michael Schmitt // Jürgen Popp // Thomas W. Bocklitz
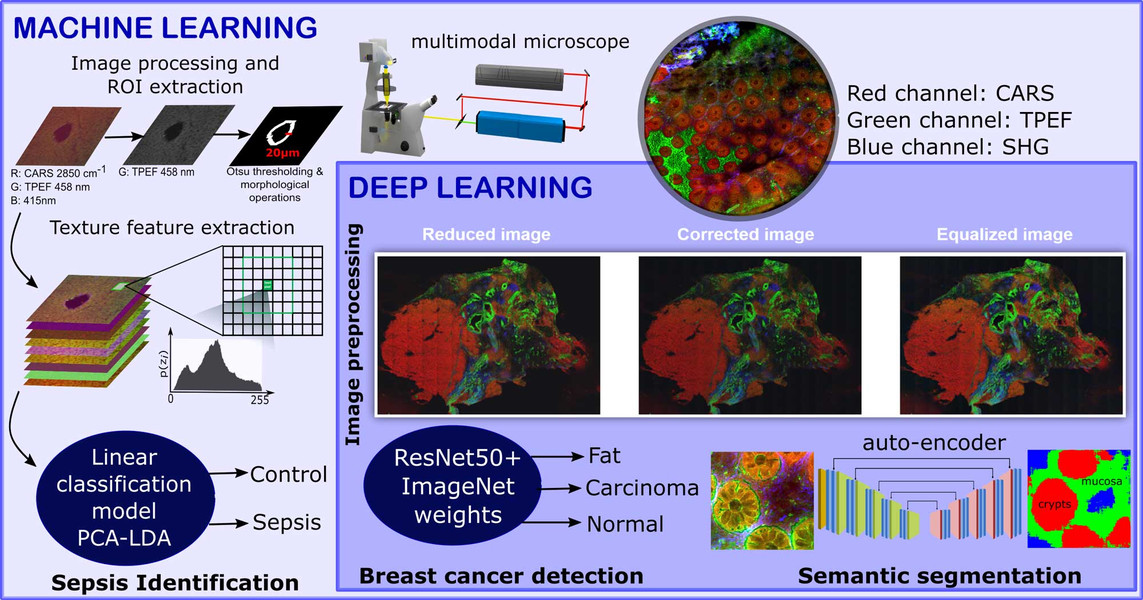
Non-linear multimodal imaging combining coherent anti-Stokes Raman scattering (CARS), two-photon excited autofluorescence (TPEF), and second-harmonic generation (SHG) allows label‐free investigations and biomedical diagnostics. These three individual image modalities provide information about different biomolecules. For example, CARS microscopy can be employed to visualize the distribution of the CH-stretching vibration, TPEF microscopy can measure endogenous fluorophores like NADH, FAD and elastin fibers, and lastly SHG microscopy can provide information about fiber like structures. These non-linear modalities provide a direct visualization of not only the cell and tissue morphology, but also the biomolecular alterations associated to disease progression.
However, these modalities are untargeted which makes the manual interpretation difficult. To circumvent this issue, sophisticated image analysis approaches are required for the interpretation of the acquired image data. In our contributions, the non-linear multimodal images are analyzed using machine learning and deep learning algorithms. We utilize the combination of non-linear multimodal imaging and machine learning/deep learning to solve different biomedical tasks including the detection of breast cancer (Ali, 2019), the early identification of sepsis (Yarbakht, 2019) and the semantic segmentation of crypt structures for a characterization of inflammatory bowel diseases (Bocklitz, 2019).
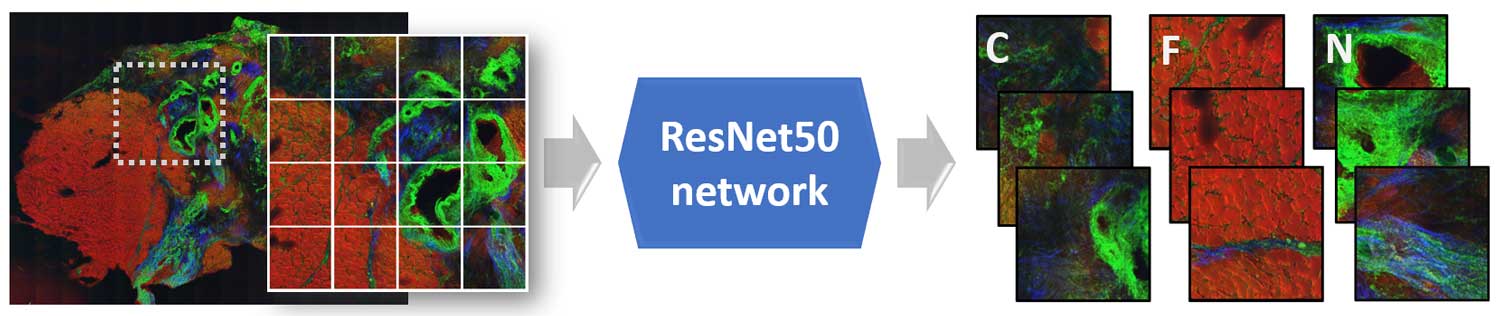
The identification of sepsis in a mouse model of peritonitis was carried out using a classical machine learning model that combined extracted texture features of the non-linear multimodal images, a principal component analysis and a linear discriminant analysis (PCA-LDA). In contrast, an automatic detection of breast cancer was achieved using a deep learning approach. This approach used a fully connected convolutional neural network called ResNet50. Here, the pretrained version of the ResNet50 network on the ImageNet dataset was fine-tuned to identify the breast cancer regions via patch-based convolutional neural network approach. Although the sample sizes of the above-mentioned tasks were small, machine learning algorithms showed promising identification results for sepsis and breast cancer. The performance of the two image classification tasks was evaluated using the class sensitivity or the area under the curve (AUC) of a receiver operating characteristics curve.
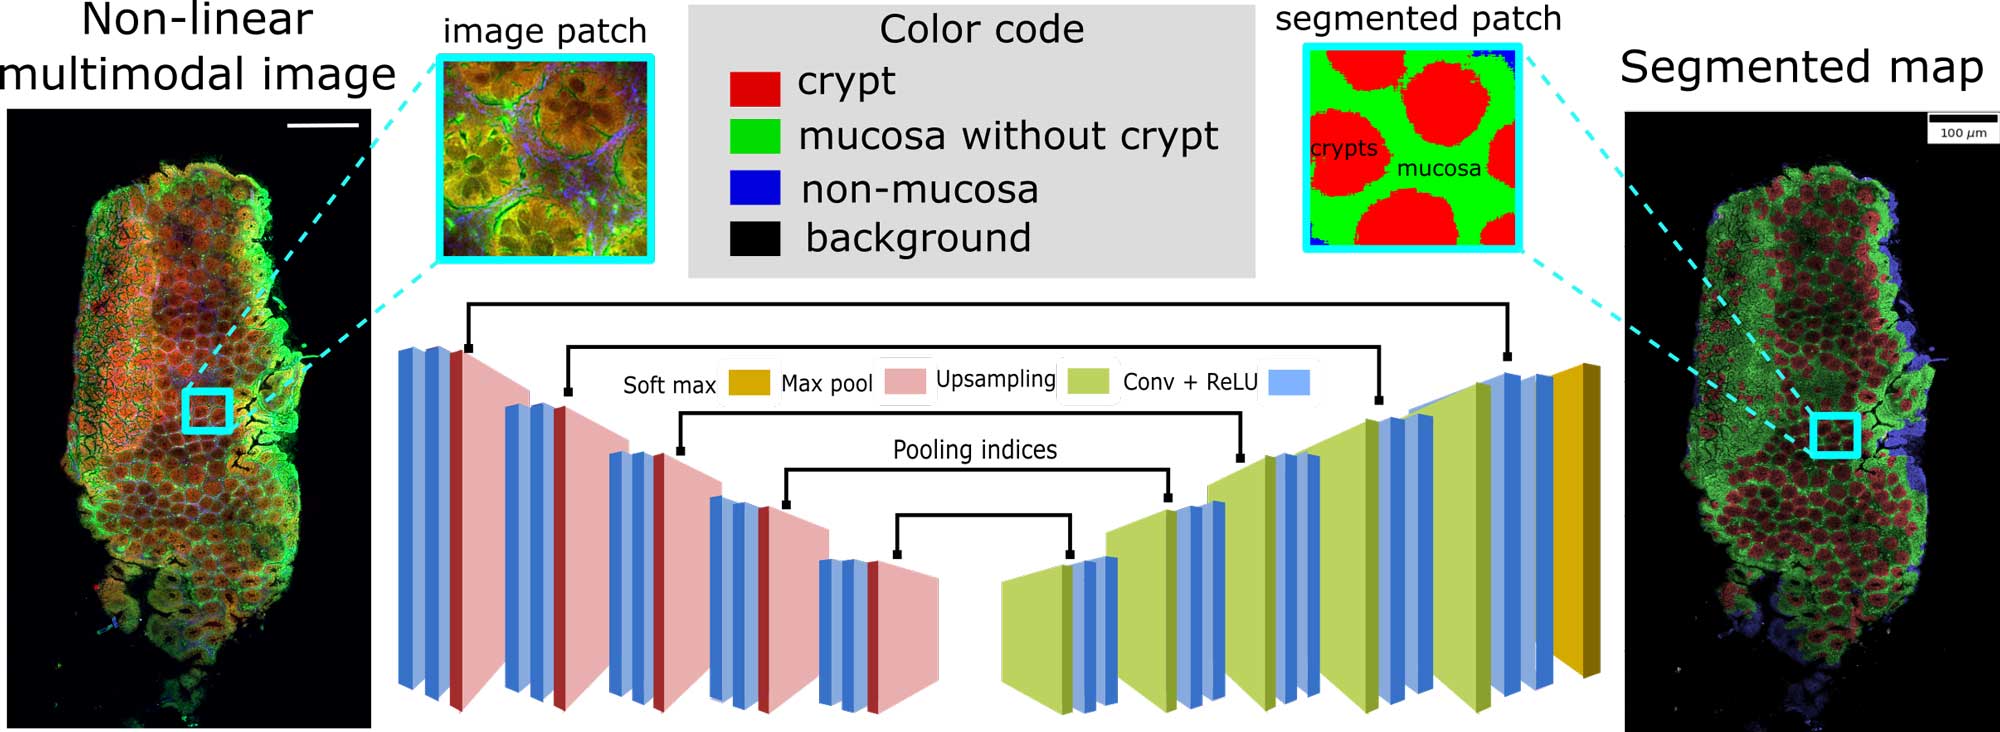
Semantic segmentation of crypts in non-linear multimodal images was performed by an advanced auto-encoder model (SegNet). The input to the SegNet model was a non-linear multimodal image and the output was a segmented image with four different regions: background, non-mucosa, mucosa without crypts and crypts. These regions especially the mucosa region and the crypts are crucial indicators for inflammatory bowel disease (IBD). Its automatic segmentation without any manual intervention can lead to automatic characterization of IBD.
Overall, the non-invasive nature of this imaging technique enables in vivo measurements, which offers a low‐risk diagnostic approach for various diseased. If adequate machine learning / deep learning approaches are combined with these non-linear multimodal imaging techniques, an automatic decision-making system for biomedical diagnostics including the detection of breast cancer (Ali, 2019), the early identification of sepsis (Yarbakht, 2019) and the semantic segmentation of crypt structures for a characterization of inflammatory bowel diseases (Bocklitz, 2019) can be achieved.
Related Publications:
- Ali, N. a. (2019, 11). Automatic Label‐free Detection of Breast Cancer Using Nonlinear Multimodal Imaging and the Convolutional Neural Network ResNet50. Translational Biophotonics. DOI: 10.1002/tbio.201900003
- Bocklitz, P. P. (2019). Semantic Segmentation of Non-linear Multimodal Images for Disease Grading of Inflammatory Bowel Disease: A SegNet-based Application. Proceedings of the 8th International Conference on Pattern Recognition Applications and Methods - Volume 1: ICPRAM (pp. 396-405). SciTePress. DOI: 10.5220/0007314003960405
- Yarbakht, M. a.-V. (2019). Nonlinear Multimodal Imaging Characteristics of Early Septic Liver Injury in a Mouse Model of Peritonitis. Analytical chemistry, 91(17), 11116--11121. DOI: 10.1021/acs.analchem.9b01746
Funded by: EU, BMBF, DFG, Thuringia
Feature Extraction in Raman Spectral Data Analysis
A Raman-spectroscopy based classification can fail to learn the pattern of the inter-group differences due to the intra-group spectral variations. A natural solution is a well-designed feature extraction method that can separate the intra-group variations from the inter-group differences; the classifier is then built based on merely the latter information. To do so, we modified two commonly applied feature extraction approaches, principal component analysis (PCA) and partial least squares (PLS), in order to extract the features representing merely the inter-group differences.
By Shuxia Guo // Petra Rösch // Jürgen Popp // Thomas Bocklitz
Raman spectroscopy saw dramatic growth in the last two decades in biological applications, including but not limited to toxicology and forensics, microbiology, drug discovery, metabolic investigations, and even in vivo detection [1]. This has largely benefited from the development of chemometrics, where the Raman signals are translated into high-level chemical and/or biological information of interested, mostly using a classification model [2]. However, the Raman-based classification is often degraded by the intra-group spectral variations, which can easily overwhelm the subtle inter-group spectral differences of interest. To deal with this issue and hence improve the performance of the classification, we modified two commonly applied feature extraction methods, PCA and PLS, so that the extracted features represent merely the inter-group differences. The details can be found in publication [3]. Herein the methods will be briefly summarized, along with their results on two Raman spectral datasets measured from biological samples. The idea of modified PCA is given as following:
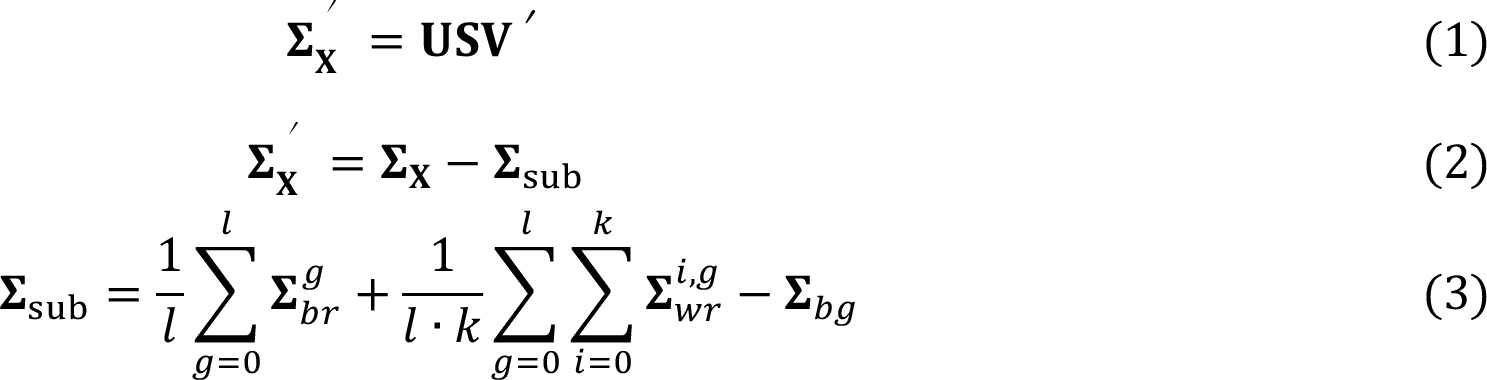
The ∑x, ∑sub, and ∑'x represents the overall covariance, the intra-group covariance, and the inter-group covariance, respectively. The is the covariance matrix of the mean spectra of each replicate belonging to the gth group, while is the covariance matrix of the ith replicate belonging to the gth group. ∑bg is the covariance matrix of the mean spectra of each group. By subtracting ∑sub from ∑x, the resulted principal components V from the singular value decomposition (Eq. (1)) are supposed to indicate merely the inter-group differences.
The modified PLS (mPLS) was achieved by orthogonalizing the projection vectors (P) against Lsub during the iteration of the SIMPLS algorithm. The orthogonalization was done according to Eq. (4), where Lsub are the loadings resulted from Eq. (1), which represent the intra-group variations. The resulted projection vectors Pot were used to obtain score vectors of mPLS.

The methods were verified with two Raman spectral datasets measured from mice colon tissues and bacteria, respectively. The performance was compared to their ordinary counterparts according to the mean sensitivity of the classifications. Accordingly, the mPCA was proven to improve the generalization of the classifier while the mPLS helps to avoid overfitting. Due to the limit of space, only the results of the mice data will be described in the following paragraphs.
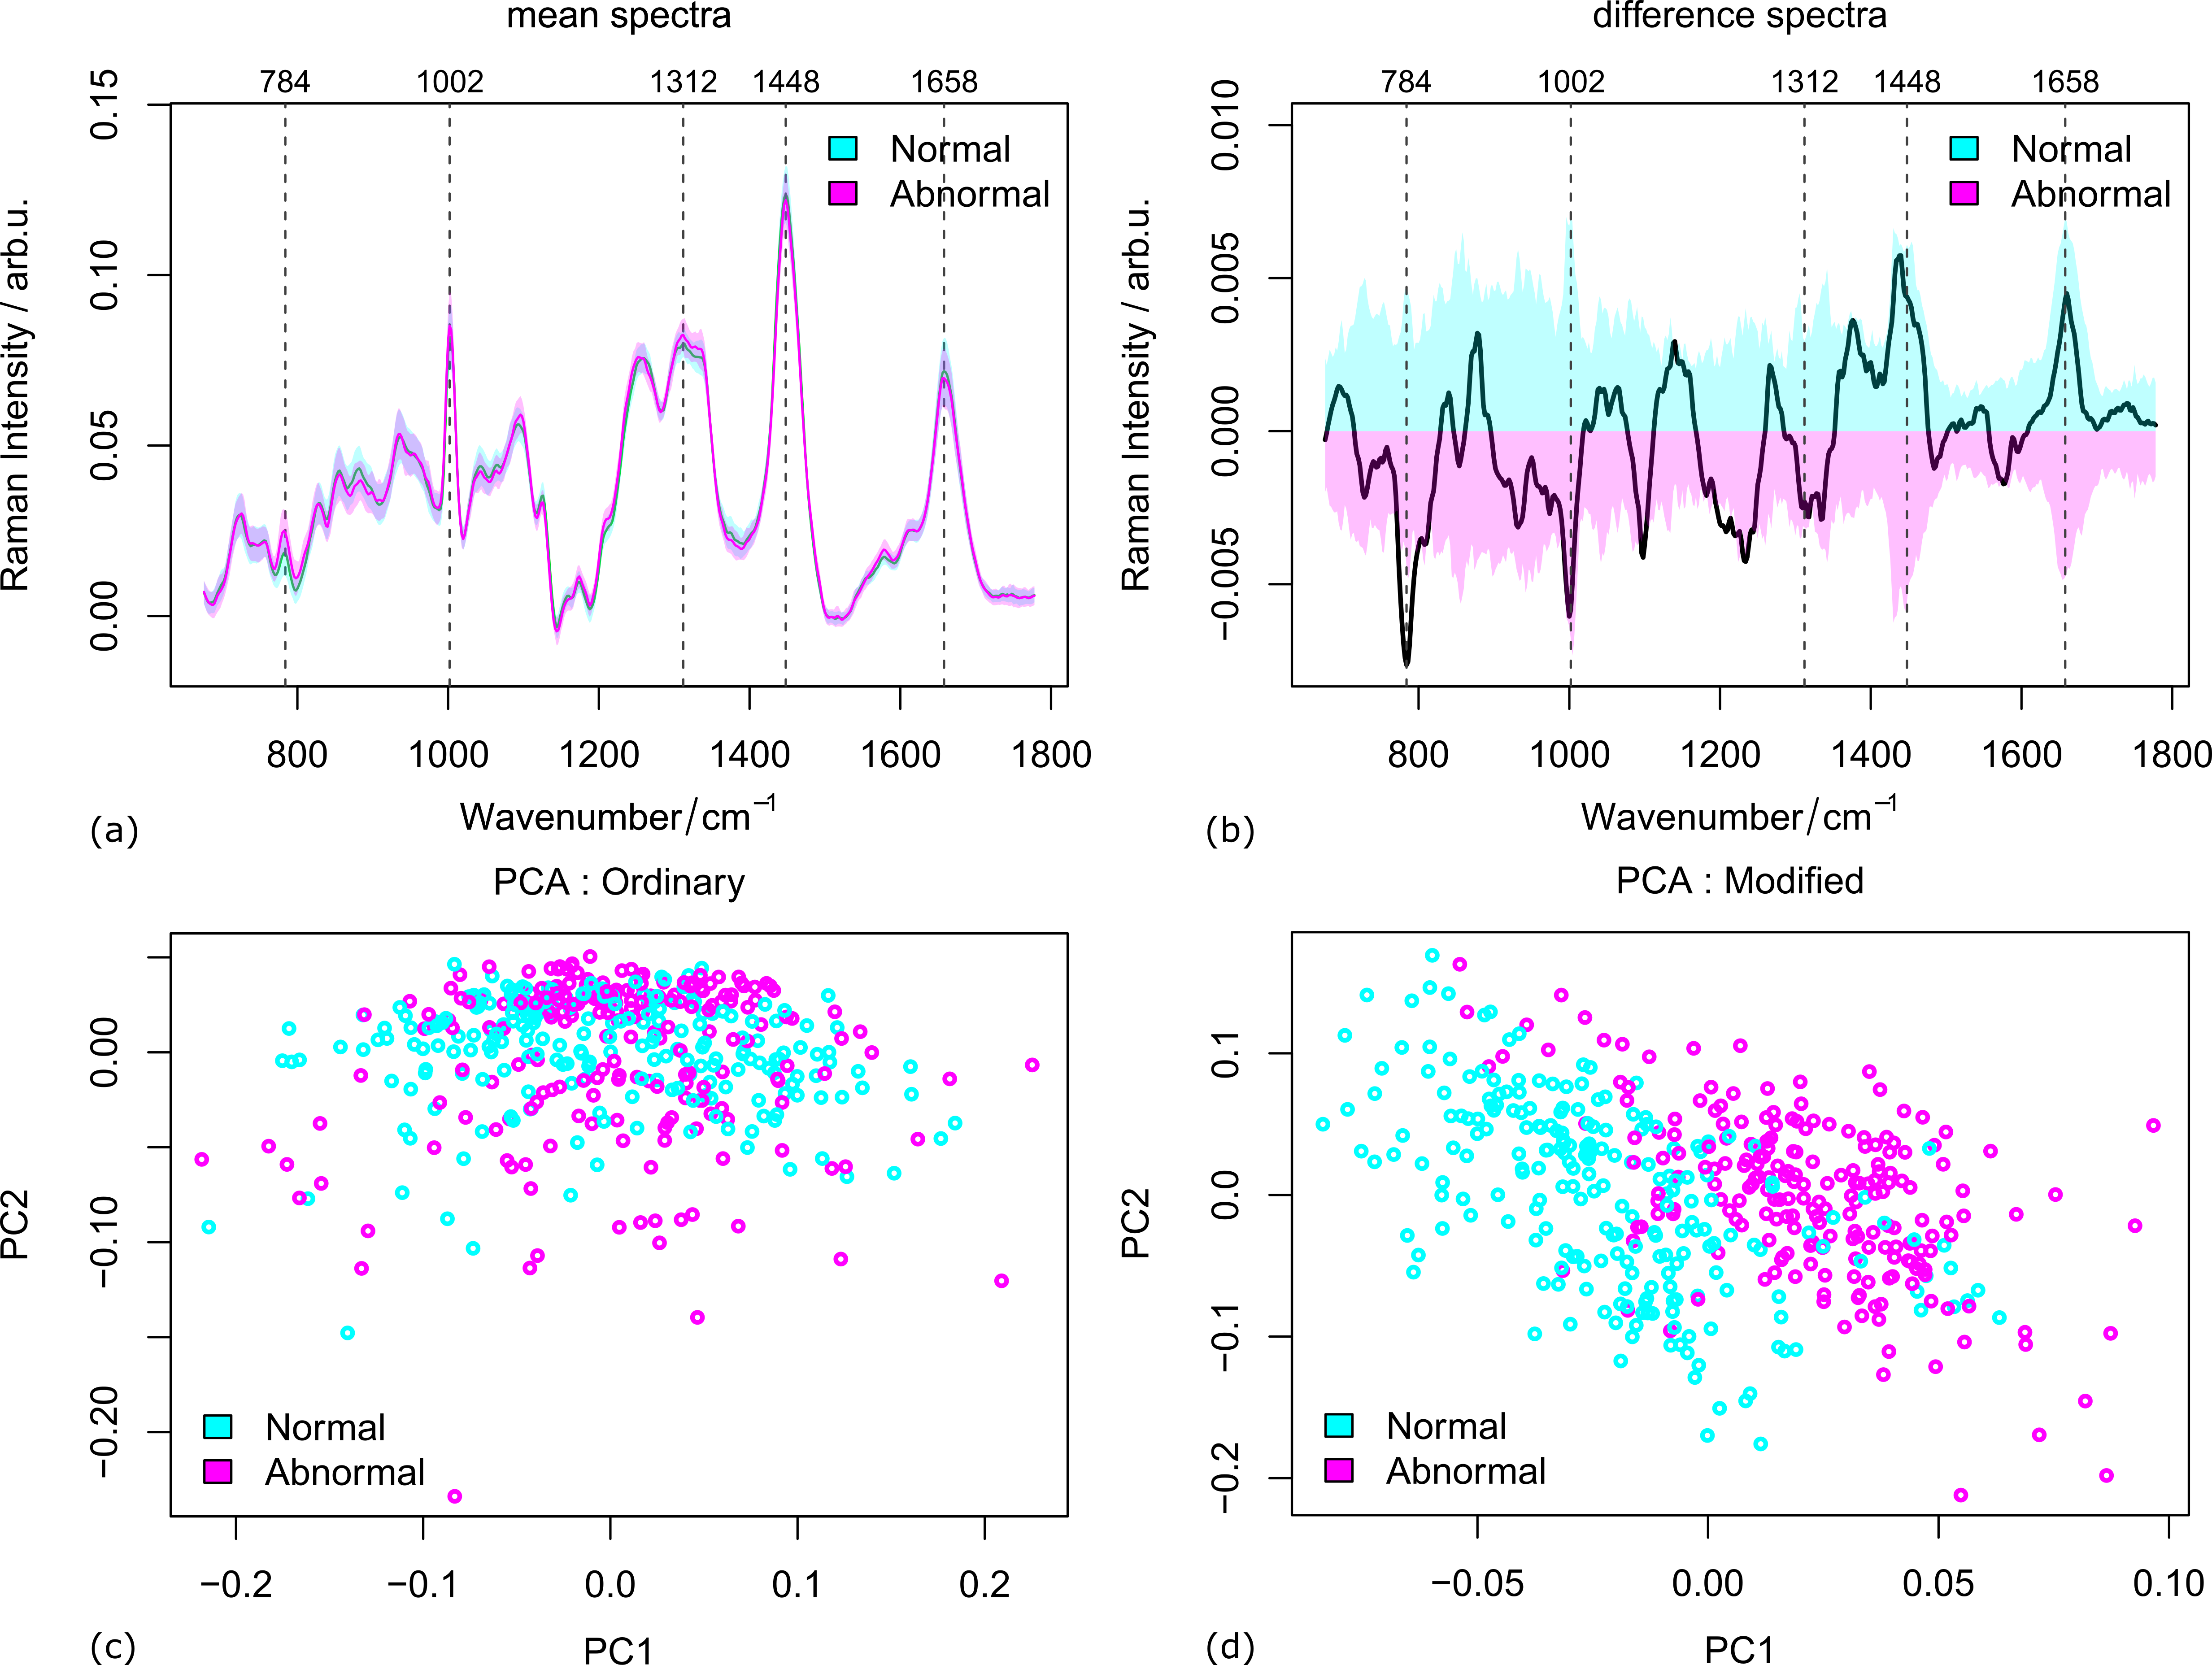
The mice data was measured in two cases: fully prepared samples from 47 individuals and biopsy samples from 97 individuals (details see ref. [4]). The mean spectra of both abnormal from normal samples are plotted in Figure 1 (a-b) along with the variances and their difference spectra. The peaks where the two groups are significantly different are marked by vertical lines. From the score plots in Figure 1(c-d), it is clear that the two groups are hardly distinguishable with the first two components of the ordinary PCA. A much better separation was observed in the case of modified PCA. That is to say, the inter-group variations are better extracted by modified PCA.
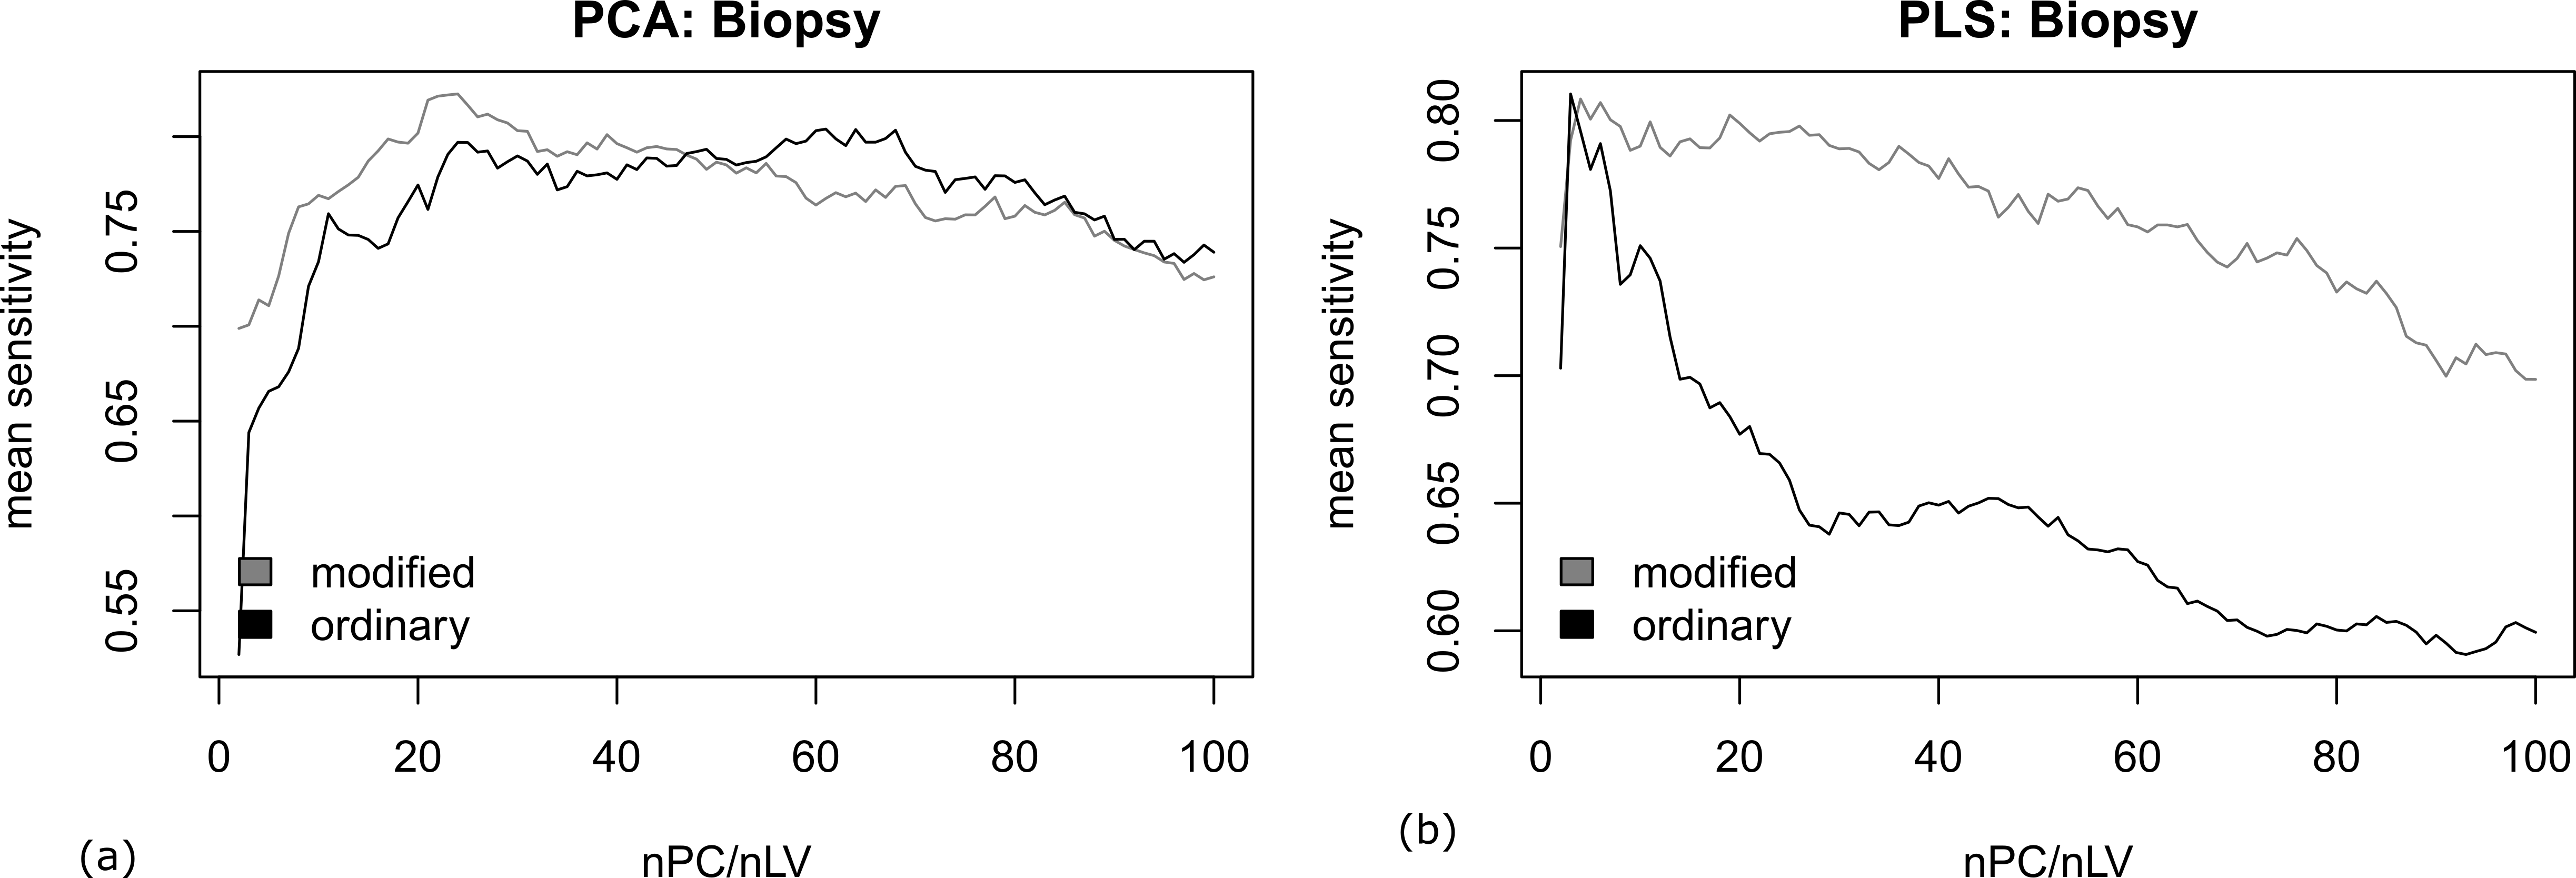
In addition, we tested the performance of the mPCA and mPLS according to the prediction on biopsy samples using the classifier built on prepared samples. The mean sensitivity of the prediction is visualized in Figure 2. Despite the ordinary and modified PLS gave comparable highest mean sensitivity over different number of components (nLV), the classification is shown more stable to the number of components (nLV) in the case of mPLS. In contrast, the highest mean sensitivity was clearly improved with mPCA than its ordinary counterpart. This demonstrate that the classifier is more tolerant to the differences between the prepared and biopsy samples (i.e., a better generalizability of the classification) in the former case.
Related Publications:
[1] Bocklitz, T., et al., Raman based molecular imaging and analytics: a magic bullet for biomedical applications!? Anal. Chem., 2016. 88: p. 133–151. DOI: 10.1021/acs.analchem.5b04665
[2] Ryabchykov, O., Guo, S., and Bocklitz, T., Analyzing Raman spectroscopic data. Physical Sciences Reviews, 2019. 4(2). DOI: 10.1515/psr-2017-0043
[3] Guo, S., Rösch, P., et al., Modified PCA and PLS: Towards a better classification in Raman spectroscopy–based biological applications. Journal of Chemometrics, 2019, e3202. DOI: 10.1002/cem.3202
[4] Vogler, N., et al., Systematic evaluation of the biological variance within the Raman based colorectal tissue diagnostics. Journal of biophotonics, 2016. 9(5): p. 533-541. DOI: 10.1002/jbio.201500237
Acknowledgements:
The authors acknowledge the funding from project Uro-MDD (FKZ 03ZZ0444J) of 3Dsensation and the project BO4700/4-1 from German Research Foundation (DFG) as well as the projects Intersept (FKZ 13N13852) and CarbaTech (FKZ 01ET1701) from the BMBF. The scholarship from China Scholarship Council (CSC) for S.G is highly appreciated.
Open Source Implementation of Two-dimensional Correlation Analysis – The corr2D Package In R
Two-dimensional correlation analysis is a sophisticated data analysis method used to investigate spectral changes that occur with respect to an external perturbation. We developed an open-source software package “corr2D” to allow spectroscopists to use this sophisticated data analysis technique and to make two-dimensional correlation analysis more accessible and transparent.
By Thomas Bocklitz
INTRODUCTION TO 2D CORRELATION ANALYSIS
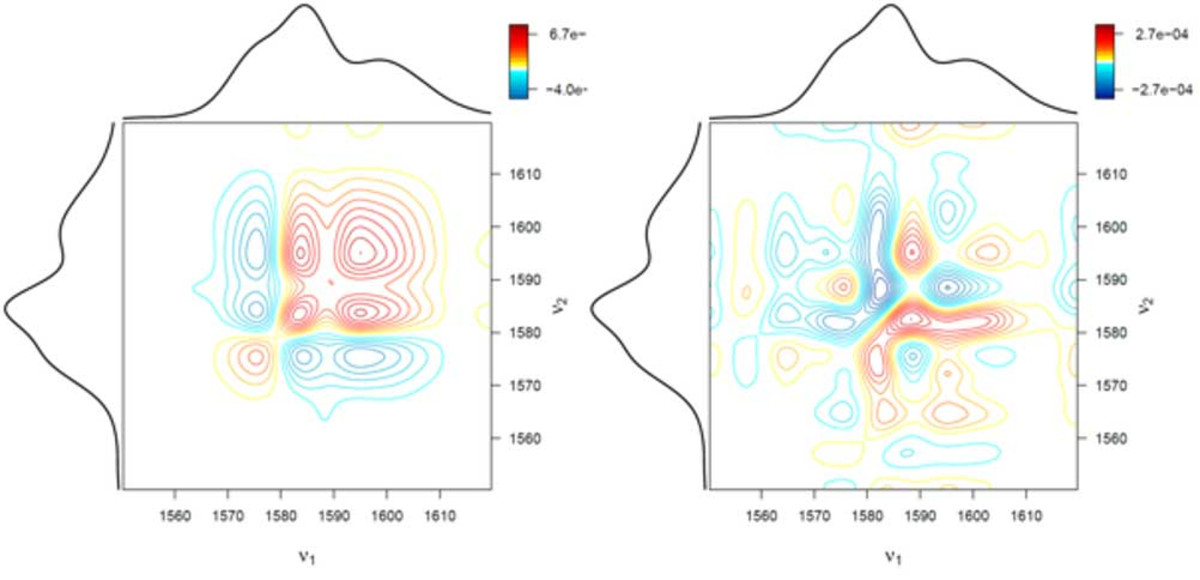
spectrum (right) and symmetric 2D correlation spectrum (left)
Infrared (IR), Raman, and nuclear magnetic resonance (NMR) spectroscopy are utilized to study molecules. This is done by assigning spectral signals to molecular structures or molecular properties. This procedure is problematic if a series of spectra is analyzed and the spectral signals strongly overlap. To solve this issue, two-dimensional (2D) correlation analysis was developed. This method was derived from the general auto- and cross-correlation integrals in the 1990s. By applying correlation analysis, a researcher can analyze how similar (or dissimilar) two spectral signals change with respect to some external variables. As described, 2D correlation analysis is employed in spectroscopy and spectrometry if spectral features need to be studied which may be obscured or overlapped in classic one-dimensional (1D) plots of the spectra. 2D correlation analysis has many applications in spectroscopy, especially in the study of dynamic systems when a perturbation occurs. It is widely applied to analyze IR, Raman, NMR, UV/Vis, and mass spectra of polymers, reaction solutions, and pharmaceuticals.
DEVELOPMENT OF OPEN SOURCE IMPLEMENTATION IN R
To make the 2D correlation analysis accessible for a spectroscopist, we developed an open-source R package. To make the method transparent, we showed how the mathematical equations are translated into R code. Additionally, the paper [1] features a simple tutorial with executable code for beginners; it characterizes how fast the implementation is, especially with respect to the parallelization of the fast Fourier transformation-based correlation analysis.
The R package “corr2D” offers the possibility to use 2D correlation analysis in the open-source language R; thus, the full data analysis chain from the pre-processing to the correlation to the post-processing of the spectroscopic data can be performed with a single software.
SPEED TESTS
The R package “Corr2D” uses parallelization to speed up the calculation process of the fast Fourier transformation involved. In the paper [1], the influence of the parallelization and the influence of the input matrix dimensions was tested and a benchmark with simulated data performed.The simulated spectral data contained a consecutive first order reaction, and this reaction was utilized in Noda et al [2]. The calculations were done with a few cores, and we compared the computational time for our software and a commercial-available software called “2DShige”.
The speed test revealed that the parallelization speeds up the calculation of large input matrices while it slows down the calculation for smaller input matrices. This is clear because small tasks need to be transferred to the calculating cores. Later the results of all these small calculations need to be put together as a result of the parallelized calculations. Thus, a parallel computation is always a trade-off between speeding up the calculation process and increasing the amount of traffic needed to organize the parallel computation. For small input matrices the correlation speed differences are hardly noticeable, while the speed differences are much larger if the input matrices are getting bigger.
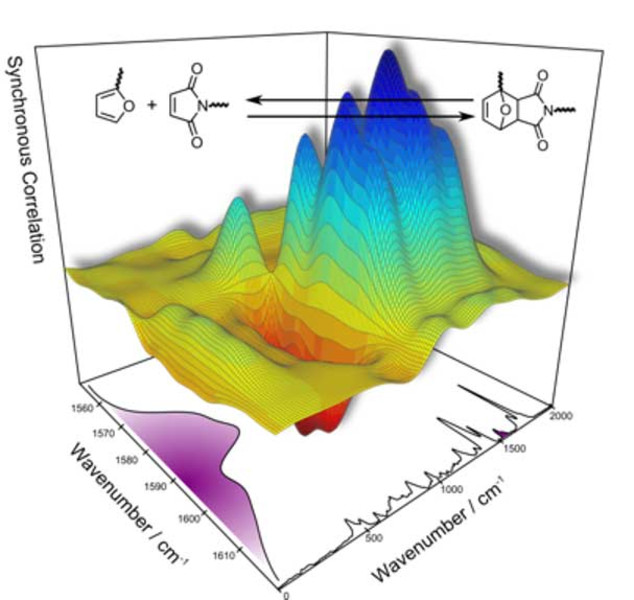
IMAGING CAPABILITIES AND PLOTTING
Another advantage of the R language is its excellent plotting capabilities. We generated a function which allows the easy generation of conventional 2D correlation spectra shown in Figure 1, as well as advanced 3D visualization such as the ones shown in Figure 2.
Related Publications:
[1] R. Geitner; R. Fritzsch; J. Popp & T. W. Bocklitz, corr2D – Implementation of Two-Dimensional Correlation Analysis in R, J. Stat. Softw., 2019, 90, 1-10. DOI: 10.18637/jss.v090.i03
[2] I. Noda, Frontiers of two-dimensional correlation spectroscopy. Part 1. New concepts and noteworthy developments, J. Mol. Struct., Elsevier, 2014, 1069, 3-22. DOI: 10.1016/j.molstruc.2014.01.025
Investigations on Raman Spectral Data Analysis
If a Raman spectroscopy-based classification model is utilized to predict data measured on a different device or from a different biological replicate compared to the training data, the model’s performance is typically low. This problem can be tackled by transfer methods. We investigated Tikhonov regularization (TR)-based transfer methods and checked the model’s transfer performance.
By: Shuxia Guo // Ralf Heinke // Stephan Stöckel // Petra Rösch // Jürgen Popp // Thomas Bocklitz
Raman spectroscopy has been proven to be a versatile tool for biological studies including toxicology, microbiology, drug research, metabolic investigations, and forensic analysis [1]. These applications of Raman spectroscopy are only possible by using chemometrics for Raman spectral data analysis. Chemometrics improves the sensitivity of Raman-based biological detections, thanks to its capability of distinguishing subtle spectral variations caused by biological alterations. Therefore, we apply chemometrics in Raman-based biological studies and investigate possibilities of enhancing the outcome of the chemometric models. One of our investigated issues is the model transfer problem, which is required if the test data bears a significant difference to the training data due to variations in the different replicates or instruments. Model transfer approaches enable the trained model to successfully predict this new data without using a large amount of new training samples measured under the changed conditions. This is necessary especially if the new training samples are expensive or impossible to acquire, as in most biological studies. The training data is termed primary data, while the new data measured under different conditions is called secondary data.
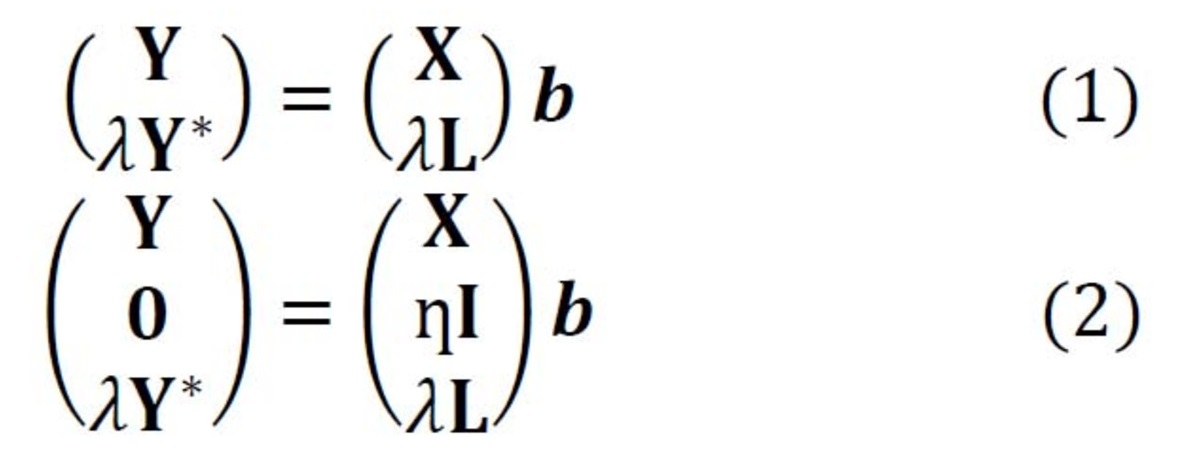
In Raman spectroscopy, the most commonly applied model transfer method is standard calibration [2], in which the spectral variations between instruments are eliminated based on standardization measurements. However, the standard calibration does not have any effect on the variations in the replicates, which is one of the major causes of a failed prediction in biological applications. For this reason, we developed two approaches based on Tikhonov regularization (TR) [3], termed TR1 and TR2 [4]. The equations of these two approaches are given in Eq. (1-2), respectively. The method works by augmenting the training (primary) data (X,Y) with a few secondary training samples (L,Y*), which are called transfer spectra.

We based the investigation on the Raman spectra of three spore species (B. mycoides, B. subtilis, and B. thuringiensis) measured on four devices. A three-group classification model was constructed with a partial least square regression (PLSR). Each device was once used as secondary data and predicted by models trained with one or more of the other devices. In particular, for each case of secondary data, we randomly selected fifteen secondary spectra as optimization spectra, with five belonging to each group. The parameters λ and ƞ were optimized by genetic algorithms to maximize the prediction of these optimization spectra. The calculation was conducted on Raman spectra with or without standard calibration (STD). The prediction accuracy on the secondary data was visualized in Figure 1, which was significantly improved after model transfer (i.e., compared to the prediction without model transfer). Both methods, namely TR1 and TR2, were able to significantly improve the prediction, even without carrying out a standard calibration. Nonetheless, TR2 is superior to TR1.
Funded by: China scholarship council, BMBF, EU
RELATED PUBLICATIONS
[1]. Bocklitz T., Guo S., Ryabchykov O., Vogler N., Popp J., Raman Based Molecular Imaging and Analytics: A Magic Bullet for Biomedical Applications!? in Analytical Chemistry. 2016; 88 (1): 133-151. DOI: 10.1021/acs.analchem.5b04665
[2]. McCreery R.L., John Wiley & Sons, 157(2000).
[3]. Kalivas J.H., Siano G.G., et al., Calibration Maintenance and Transfer Using Tikhonov Regularization Approaches in Applied spectroscopy, 63(7), 800-809(2009). DOI: 10.1366/000370209788701206
[4]. Guo S., Heinke R., Stöckel S., Rösch P., Bocklitz T., and Popp J., Towards an improvement of model transferability for Raman spectroscopy in biological applications in Vibrational Spectroscopy, 2017, 91, 111-118. DOI: 10.1016/j.vibspec.2016.06.010
Multimodal Image Analysis for Tissue Diagnostics
The tissue diagnostics of skin melanoma was achieved by multimodal imaging combined with an automatic image analysis. Normal epithelial, melanoma, and other skin tissues were successfully distinguished by a hierarchical classifier based on a first-order histogram and GLCM textural features calculated in a local model. Textural features based on a first-order histogram have meanwhile been proven superior to those based on GLCM according to the classification results.
By: Shuxia Guo // Tobias Meyer // Jürgen Popp // Thomas Bocklitz // Susanne Pfeifenbring
Most diseases change tissue structures and functions; therefore, information on the biological alterations can be deduced from tissue measurements. This information can be utilized for tissue diagnostics and disease detections. The ‘gold standard’ diagnosis method for many diseases is still histopathological examination [1]. In this method, the tissue is removed, sectioned, stained, and imaged via microscopy. The microscopic images are inspected by a pathologist who conducts the diagnosis according to the visual characteristics of the tissue. The requirement of tissue biopsy and staining makes histopathological examination unsuitable for in vivo diagnosis and also leads to a long time delay between resection and diagnosis. More importantly, the diagnosis depends on the pathologist, and different pathologists may conduct controversial diagnostics for the same tissue section. These issues motivated us to apply multimodal imaging for tissue diagnosis, which refers to the combination of two-photon excited fluorescence (TPEF) and second harmonic generation (SHG). Multimodal imaging is label free, noninvasive, and provides a molecular contrast; hence the technique is ideally suited for in vivo diagnostics [2]. One illustrative example of our tissue-based studies is the diagnostics of skin melanoma, which is a common cancer in the western world and the annual occurrence has increased by 4.6% from 1975 to 1985 and 2.7% from 1986 to 2007 [3]. To achieve clinical application, however, it is required to translate the optical signals into high-level diagnostically relevant information.
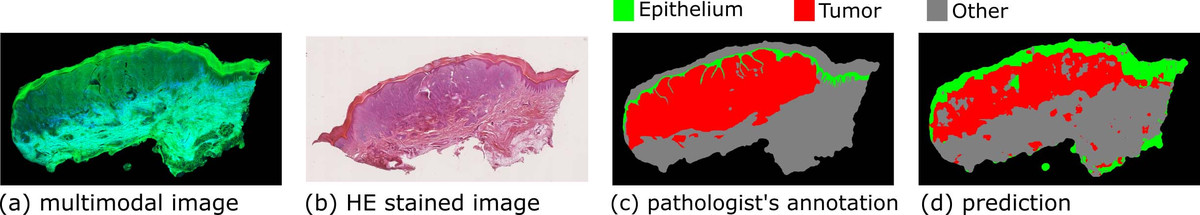
Therefore, we established an image analysis pipeline and benchmarked its performance by multimodal images measured from thirteen human skin tissues with melanocytic lesions [4]. After multimodal imaging, these tissues were HE (hematoxylin and eosin) stained, imaged via a microscope, and inspected by an experienced pathologist to annotate the (normal) epithelial and tumor regions. The image analysis starts with the removal of uneven illumination artefacts through the combination of wavelet and Fourier transformation. Thereafter, the background estimation and intensity standardization follow. In the next step, textural features including first-order histogram features and the local gray-level co-occurrence matrix (GLCM) features were calculated using moving windows with different window sizes. On the basis of these textural features, a hierarchical statistical model, which is composed of Fisher’s discriminant ratio (FDR)-based feature selection and support vector machine (SVM), was developed to distinguish three tissue types (normal epithelial, melanoma, and other tissues). The model was constructed in local mode (i.e., pixel wise) using the pathologist’s annotation as the ground truth and verified by a leave-one-image-out cross validation. The three tissue types were differentiated with satisfactory accuracy, demonstrating the great potential of multimodal imaging combined with image analysis for tissue diagnostics. Results from one of the images are shown in Figure 1 as an example. In addition, we conducted global-mode (i.e., image-wise) classification to relate the whole image to the clinical diagnosis. The prediction from leave-one-image-out cross validation fairly agreed with the clinical diagnosis. Finally, we compared the performance of the first-order histogram and GLCM-based textural features according to the FDR, as well as the results of the classification. In summary, the first-order histogram features were superior to the GLCM-based textural features for the above-described diagnostic task.
Funded by: EU, BMBF, DFG, FCI, Carl-Zeiss Foundation, China Scholarship Council, Italian Ministry for Education, University and Research
RELATED PUBLICATIONS
[1]. Bocklitz T., Guo S., Ryabchykov O., Vogler N., Popp J., Raman based molecular imaging and analytics: a magic bullet for biomedical applications!? in Anal. Chem., 2016. 88: p. 133–151. DOI: 10.1021/acs.analchem.5b04665
[2]. Vogler, N., et al., Multimodal Imaging Spectroscopy of Tissue in Annual Review of Analytical Chemistry, 2015. 8: 359-387. DOI: 10.1146/annurev-anchem-071114-040352
[3]. Rigel, D. S., Russak J., and Friedman R., The evolution of melanoma diagnosis: 25 years beyond the ABCDs in CA: A Cancer Journal for Clinicians, 2010, 60(5): 301-316. DOI: 10.3322/caac.20074
[4]. Guo S., Pfeifenbring S., Meyer T., Ernst G., von Eggeling F., Maio V., Massi D., Cicchi R., S. Pavone F., Popp J., and Bocklitz T., Multimodal image analysis in tissue diagnostics for skin melanoma in Journal of Chemometrics, 2017 DOI: 10.1002/cem.2963